

Introduction
We continue our story on the Analytics Platform setup in Picnic. Last time, we looked at the internal services data pipeline. Now we are going to look at the setup for the FCA (automated fulfillment center) pipeline.
FCA is Picnic’s own automated fulfillment center. Thousands of customer orders are prepared here every day in a highly automated manner. The ramp-up and success of FCA is critical for Picnic’s long-term success. Therefore the Analytics Platform team was looking into how to help and drive this project to success as well.
FCA’s backbone is a number of interconnected conveyor belts, which move products and groceries around the facility. This system is called the transport system (TS). As the name suggests, it transports the customers’ groceries around the facility until they are ready for shipping. The TS is not built by Picnic but is provided by a third-party supplier. As such, the inner workings of the TS are somewhat of a black box. Still, we want to analyze the journey of each item on the TS to gather analytics and identify bottlenecks. That’s why the Analytics Platform team has developed a new data pipeline: The FCA pipeline.
Pipeline overview
Since the TS is an externally developed hardware and software system, Picnic cannot change it to expose analytics events directly. However, our analysts would still like to have fine-grained insights into the flow of goods through the system.
So how can we get our hands on events for analytical purposes if we cannot change the TS to expose them?
Enter change data capture (CDC)! CDC is a software engineering practice of capturing changes (“deltas”) made to a system. In our case, we are tracking the changes of location of grocery bags as they move around the transport system. Whenever something happens on the TS, a record is written to the Postgres database. Our approach is to capture these changes and stream them via our Apache Kafka based analytics platform to our Snowflake data warehouse.
To do this, we use Debezium, a popular change data capture tool. It detects any changes made to a database and exposes them as events. In our case, we enable Debezium within the Postgres database of the TS and stream change events to the data warehouse. In the diagram below you can see the complete pipeline setup:
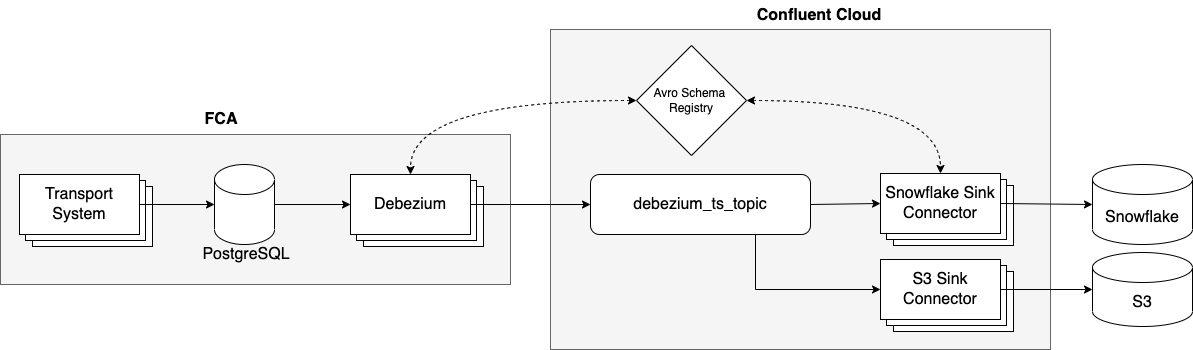
We are running Debezium as a Kafka Connect instance (“Debezium” in the diagram above). The connector publishes each change of a set of tables in Postgres to topics in Kafka. Each operation in Postgres results in a Kafka event. We have configured two sinks for the Debezium events:
- The Snowflake sink puts the data into our data warehouse for further processing and analysis.
- The S3 sink archives the data in S3 buckets.
This pipeline processes around 10–15 million events per day.
For the remainder of this blog post we’ll focus on Debezium connector, because the Kafka part has been described in detail in earlier blog posts. Now that we have a high-level overview of the setup, let’s take a look at the components in more detail.
Postgres — WAL and replication slots
Before we can capture database modifications as events, we need to enable the logical replication plugin in Postgres. Logical replication is the process of transforming the Postgres WAL (write-ahead-log) into a series of consumable changes. For each logical replication consumer, a ‘logical replication slot’ is used. In our case, the consumer will be the Debezium Kafka Connect source connector, which consumes events from said replication slot. The replication slot needs a decoding plugin that will be used to transform the WAL records to the format required by the consumer. More on this below.
Running Debezium as a Kafka Connect instance
Choosing the serialization format
By default, Debezium is publishing data in JSON format, so in an earlier iteration of the pipeline we were using JSON as serialization format. However, the JSON data the connector produces is a self-describing JSON, meaning that each event has its schema definition attached to it. This blows up the messages massively in size, which increases storage costs.
After the initial phase of running Debezium with JSON, we migrated the data to Avro as serialization format, because — being a binary format — it is much more compact, efficient and supports the use of a schema registry. Avro enables you to separate the schema from the events, leading to more concise messages. The Debezium Kafka Connector will auto-create the schema from the CDC events and handle the serialization. With Avro we were able to reduce the size of each event by 97%!
One hurdle in this migration was that, unfortunately, since Debezium 2.0.0, the Avro support is not shipped anymore with the base Debezium image. To overcome this, we execute a number of docker-maven-download commands to add those JAR files back into the Docker image (see below).
Building the Docker container
In order to expose the CDC events to Kafka, we run the Debezium Kafka Connect source connector in a Docker container. We build our own Debezium image from the Debezium base image by pulling the debezium/connect image. Then we add JVM observability to the container by adding JMX configuration to it. In addition we add the aforementioned Avro support to the container. See the full Dockerfile here.
Configuring the connector
Running this container provides you with the standard Kafka Connect REST API interface. We configure the Debezium connector with the following configuration (shortened):
"b2d2" data-selectable-paragraph="">"config": {
  "connector.class": "io.debezium.connector.postgresql.PostgresConnector",
  "name": ,  : ,  : ,  : ,  : ,  : ,  : ,  : ,  : ,  : ,  : ,  : ,  : ,  : ,  : ,  : ,  : ,  : ,  : }
